Model API
Our interface for simulating, sampling from, or plotting Markov processes is accessed through scotch model objects. The heart of scotch lies in its model objects.
Example system
We'll be implementing a two-sex birth-death process. A complete derivation of the system is provided at the end of this page; briefly, however, the context is a "human" population composed of a number of females F and males M. We assume that males and females must meet to reproduce, which they do at a rate birth. We assume that the birth of a male is as likely as the bith of a female. Additionally, males and females die at different rates, death_M and death_F, respectively. We'll use years as our unit of time.
Creating a model object using the wizard
Creating a blank model is as simple as :
model = scotch.model()
A natural place to go from here is then to call the wizard to help you generate the full model for simple systems, or perhaps just a backbone if it's a more complicated model :
model.wizard()
More on the wizard below.
Creating a model from file
Alternatively, you can pass the filename of a JSON file containing a scotch model :
model = scotch.model("mymodel.json")
Using the wizard
After initiating a scotch model using model = scotch.model(), calling model.wizard() will invoke the wizard to walk you through model creation. You'll be asked for a number of things :
- A list of state variables, and their initial conditions
- A list of parameters, and their values
- A list of events, characterised by their rates and their effects on the state variables
State variables are to be entered as a comma-separated list. In our simple birth-death process, we will specify two state variables : males and females. Hit Enter after you've entered your comma-separated list.
F, M
Initial conditions are required to be integers. You will be asked for the initial value for each state, one at a time. Hit Enter between initial conditions. Perhaps we start like this :
F : 2000
M : 1000
Parameters for this model include a reproduction rate and two death rates, one for females and one for males. The wizard asks for a comma-separated list of parameter names. You might enter :
birth, death_F, death_M
The wizard then asks for their values. Currently, parameters are fixed in value, but you have access to a few functions to make things interesting. Let's say we want our time to be in units of years, and we want the reproduction rate to be seasonal with weak annual periodicity. As before, hit Enter after entering the value of each parameter. We might go for something like :
birth : 0.05
death_F : 1/70
death_M : 1/65
Here, females have a life expectancy of 70 years, and males life for 65 years on average. Births require one male and one female, and occur at a rate of 50 per thousand individuals.
Finally, we're asked for the events that can take place in our system. There are four : birth of a female, birth of a male, death of a female, death of a male. An event is written as a comma-separated list. The first part of the list is the rate at which that event happens. Everything after that is the effect of that event on the state variables. We enter one rate per line, hitting Enter once we've finished that event. Hit enter at a blank line to finish entering events.
0.5 * birth * M * F / (M+F), F+1
0.5 * birth * M * F / (M+F), M+1
death_F * F, F-1
death_M * M, M-1
Only one state variable changes per event. If a female is born, then F is incremented by one ( F+1 ). The same happens for males. Likewise, when a male or a female dies, their respective state variable is decremented by one.
The wizard is now complete, and model contains a fully-determined scotch model.
Saving models
Models can be saved to file using
model.save("mymodel.json")
This writes a JSON file that's then easily legible and editable. You can download it here.
Simulating model realisations
You can simulate a single realisation of a model by calling
t, trace = model.simulate(tmax)
where tmax is the maximum simulation time. This returns t, an array of times, and trace, a dictionary mapping the state variables to their traces. For example, you could plot the number of males over time using plt.plot(t, trace["M"]).
The model.simulate() method takes optional keyword arguments. You can specify an algorithm :
algorithm="gillespie"algorithm="tauLeap"
If you wish to use a tau-leaping algorithm here, or if your model's default algorithm is tau-leaping, then you must also specify tau here. For example,
t, trace = model.simulate(100, algorithm="tauLeap", tau=0.1)
You can also specify silent=True if you don't want progress bars or warning messages about early termination, should no events become possible ( if, for example, your entire population has gone extinct ).
Every time you call model.simulate(), the model is reset to its initial conditions. You can pass propagate=True if you want to continue from your last simulation.
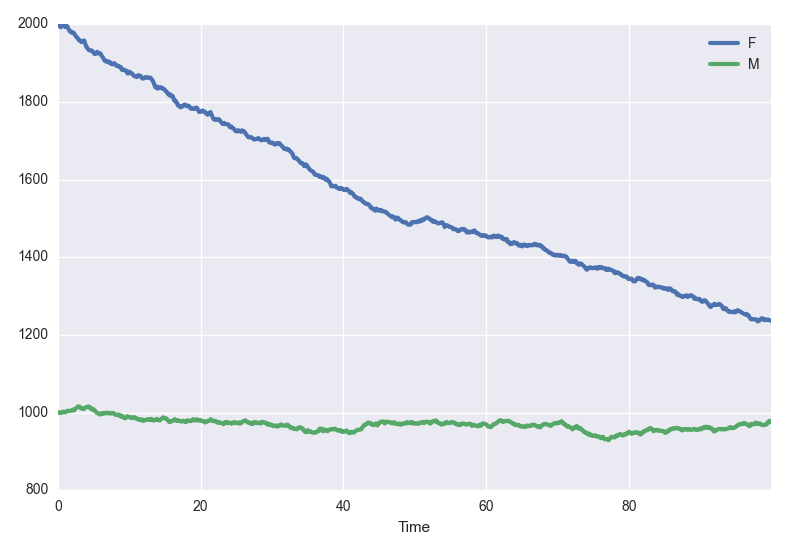
Quick-plotting single realisations
model.plot(tmax)
Under the hood, model.plot() calls model.simulate(). As such, you can pass any keywords you'd pass to model.simulate() too :
model.plot(100, algorithm="tauLeap", tau=.1, silent=True)
Sampling trajectories from the model
t, meanTrace, lowerCI, upperCI = model.sample(tmax)
Here, t is an array of times, meanTrace is the mean of all trajectories simulated, and lowerCI and upperCI and the lower and upper confidence intervals of the mean, respectively. This repeatedly simulates the system, computes the mean trajectory, and bootstraps confidence intervals for the mean. In order to compute these statistics, sample times must match; whilst this isn't a problem with tau-leaping, the random nature of event times in the Gillespie algorithm means that trajectories must be interpolated over. For consistency, we interpolate regardless of the algorithm.
All keyword arguments to model.simulate() can be passed here to model.sample. In addition, you can specify :
trajectories: the number of trajectories to simulate; default is 100bootstraps: the number of bootstrap replicates used to estimate confidence intervals around the mean; default is 500tvals: the number of time values to return during interpolation; default is 1000alpha: the confidence level of the intervals around the mean; default is 0.95
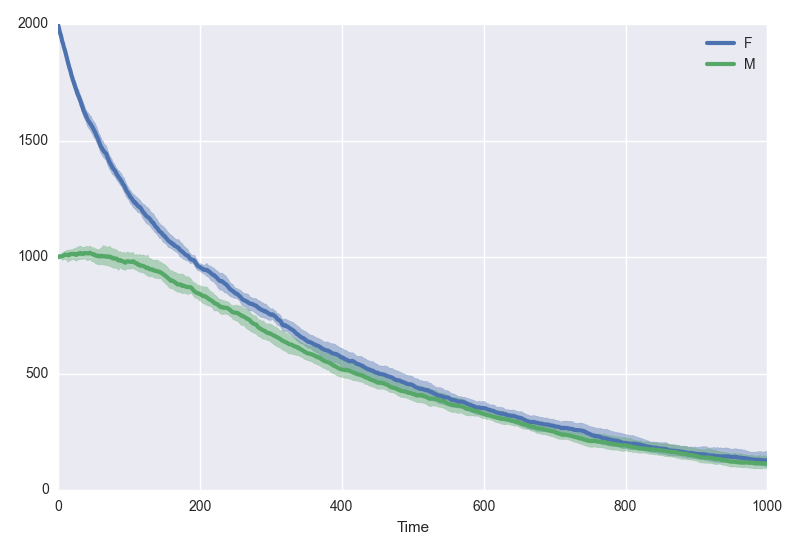
Plotting mean dynamics of the system
Combining model.sample() and model.plot(), you can sample repeatedly from your system and immediately plot its mean trajectories.
model.plotsamples(1000, algorithm="tauLeap", tau=1, trajectories=10, bootstraps=1000, alpha=0.99)
Here, we plot the mean of ten trajectories simulated by a tau-leaping algorithm, and its 99% confidence intervals, computed from 1000 bootstrap replicates.
The birth-death process example
Consider a birth-death process in which birth requires one male and one female, and the birth of a male is as likely as the birth of a female. If we denote the number of males in the population as M, and the number of females as F, when we can write the system,
where μ is the per-capita birth rate and δ is the per-capita death rate. If we let N be the total population, then
and
For a steady population, that neither grows exponentially or dies out, then
and so
In the case where there are approximately as many females as there are males, then
For a population made up of an equal number of females and males, therefore, the per-capita birth rate must be four times that of the per-capita death rate. Our example above started with twice as many females as males, which gives a birth to death ratio of 9:2 required for population stability. With the weighted average of our death rates δ, that implies a required birth rate of μ = 0.593. We used μ = 0.5, and so expect the population to decay.